Feature
Social Media Analytics Software for Frontline Workers
Your police officers, nurses, franchise operators, and field teams create content every day. ContentBridge tracks every post, every contributor, and every approval across your entire organization. See who is active, where the gaps are, and whether your social media investment is paying off. Built for distributed teams of 100 to 5,000+ frontline workers.
3 report types
Contributor, activity, leaderboard
Real-time
dashboard metrics
1-click
CSV, PDF, Excel exports
Why Most Organizations Cannot Measure Their Social Media Programme
Your frontline workers are creating content, but you cannot track who is contributing, prove social media ROI, or build a cross-platform report without losing days. Most social media reporting tools were not designed for distributed teams, so the data you need lives in five different places.

Leadership Keeps Asking What Social Media Is Worth and Nobody Has an Answer
Your board wants numbers that connect social media activity to business outcomes, and your team has nothing to show them. The CMO Survey from Duke University found that 64% of marketing leaders rank proving financial impact as their top challenge. Platform-native metrics like impressions and reach say nothing about which of your hundreds of contributors are delivering results.

Monthly Reporting Takes Days Because Every Platform Speaks a Different Language
Your social media manager pulls data from four platforms into separate spreadsheets, then spends hours formatting a report for leadership. A MarketingProfs and SocialDay survey found that social media marketers spend 3.8 hours per week on reporting alone. At organizations with dozens of accounts, relying on disconnected social media analytics platforms turns a simple question into a multi-day project.

Frontline Contributors Stop Posting Because Nobody Sees Their Effort
Organizations launch employee content programmes with energy, but participation decays when contributors receive no recognition. Gallup research found that unrecognized employees are three times more likely to quit within a year. Without leaderboards or visible activity tracking, frontline content programmes fade into silence.
How Social Media Analytics Software Turns Activity Into Answers
Every post, every contributor, every approval is already tracked. ContentBridge organizes that data into social media reporting dashboards your leadership team can actually use.
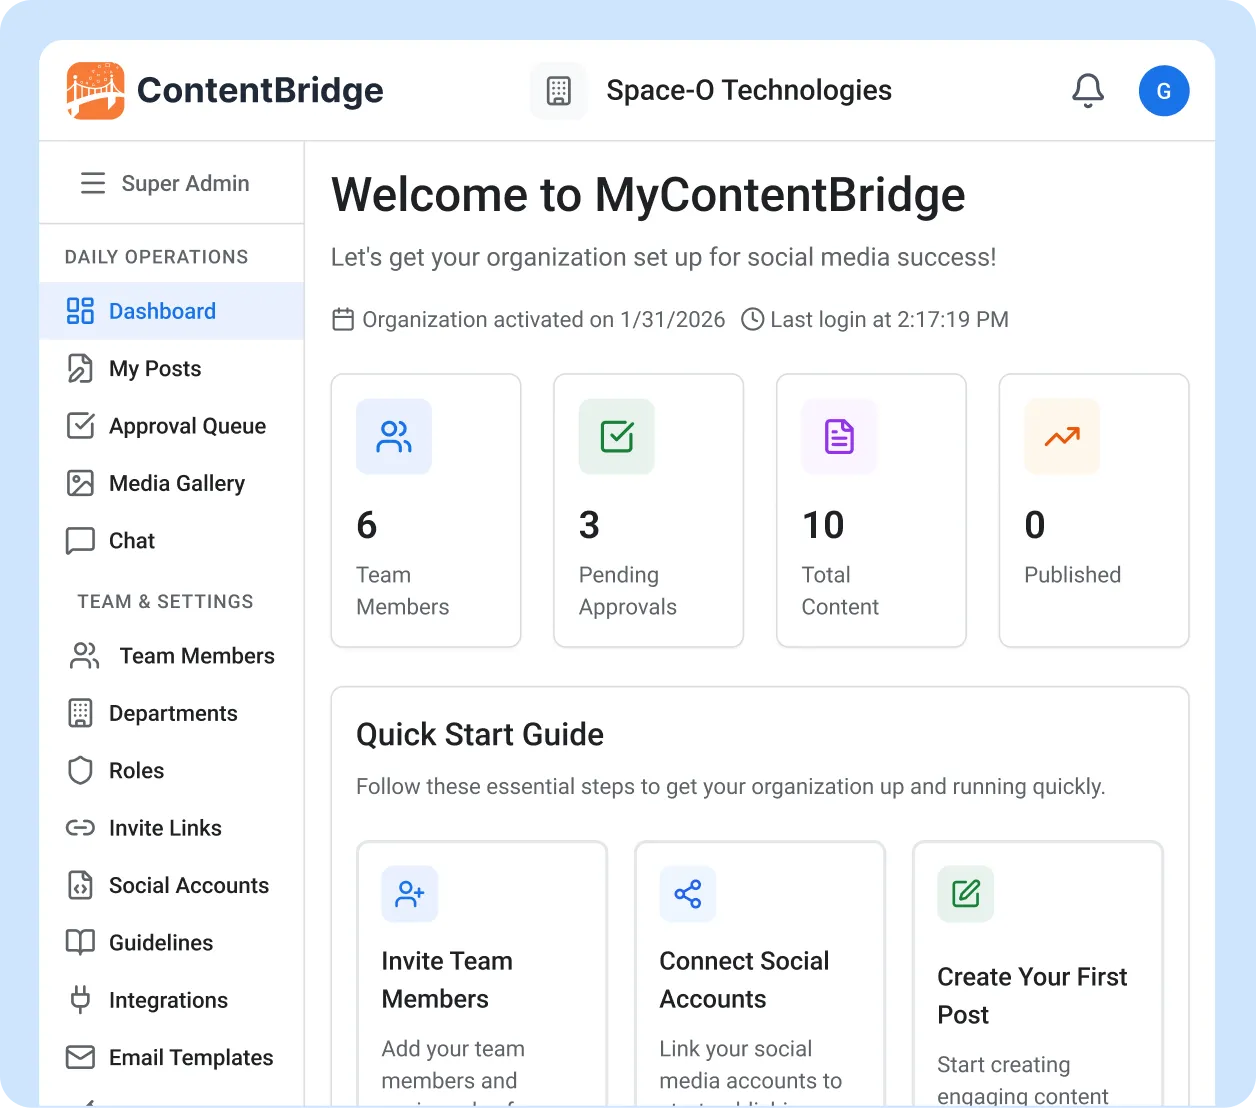
Open Your Social Media Reporting Dashboard and See the Full Picture
The moment you log in, your organization’s key social media metrics are visible. Total team members, pending approvals, total content created, and posts published this month are displayed in real time. You do not need to run a report or open a spreadsheet to know where your programme stands right now.
- Organization-wide stats updated in real time
- Pending approval count for immediate action
- Published-this-month counter for at-a-glance progress
- Quick Start Guide with onboarding links for new teams
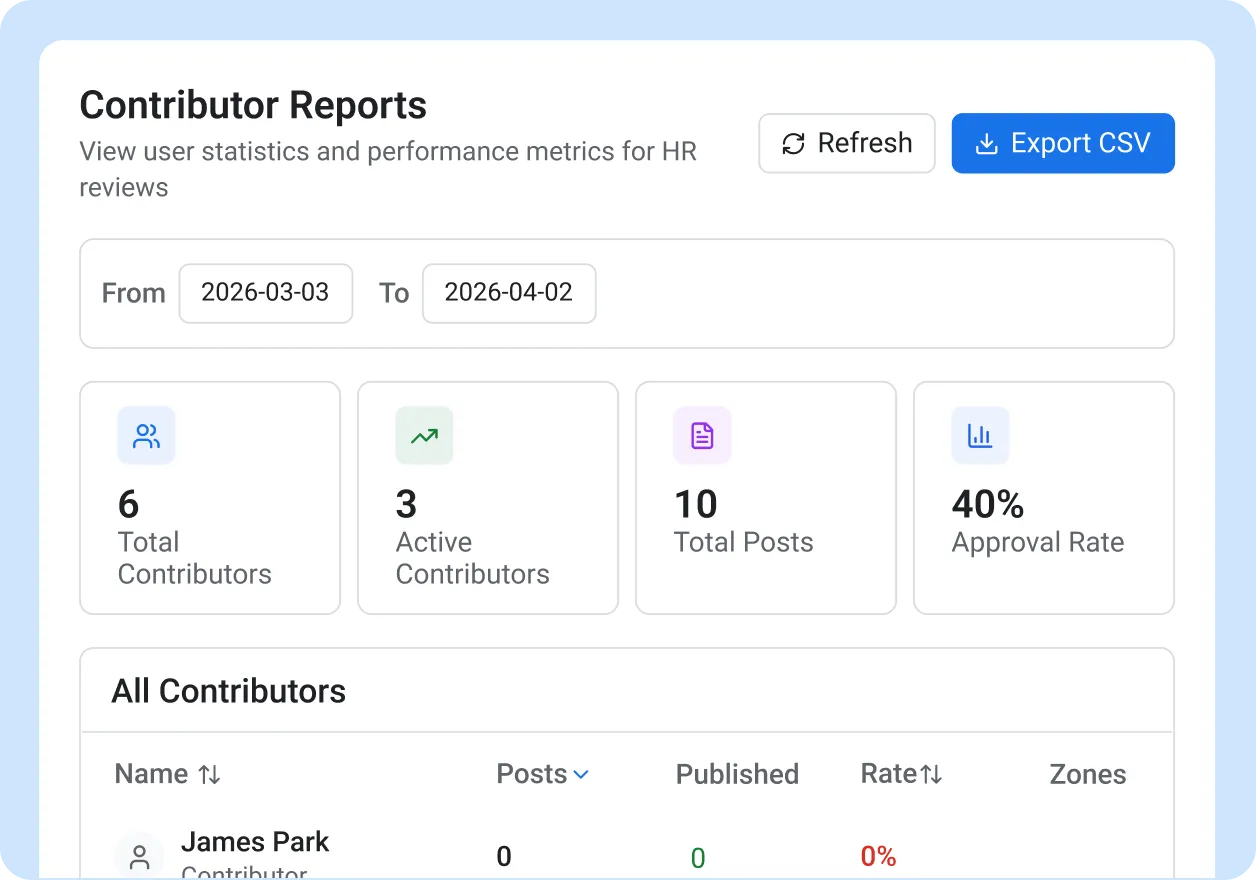
See Exactly Who Is Contributing and Who Has Gone Quiet
Whether you track employee-generated content across 10 locations or 500, contributor reports show per-user stats for every person in your organization. You see each contributor’s total posts, approved posts, approval rate, and territories covered. Sort by any column, filter by department or date range, and open a detail panel for any individual contributor.
- Per-user stats: total posts, approved, approval rate, territories
- Sortable columns and filterable views
- Contributor detail panel with full post history
- Export the full contributor report to CSV
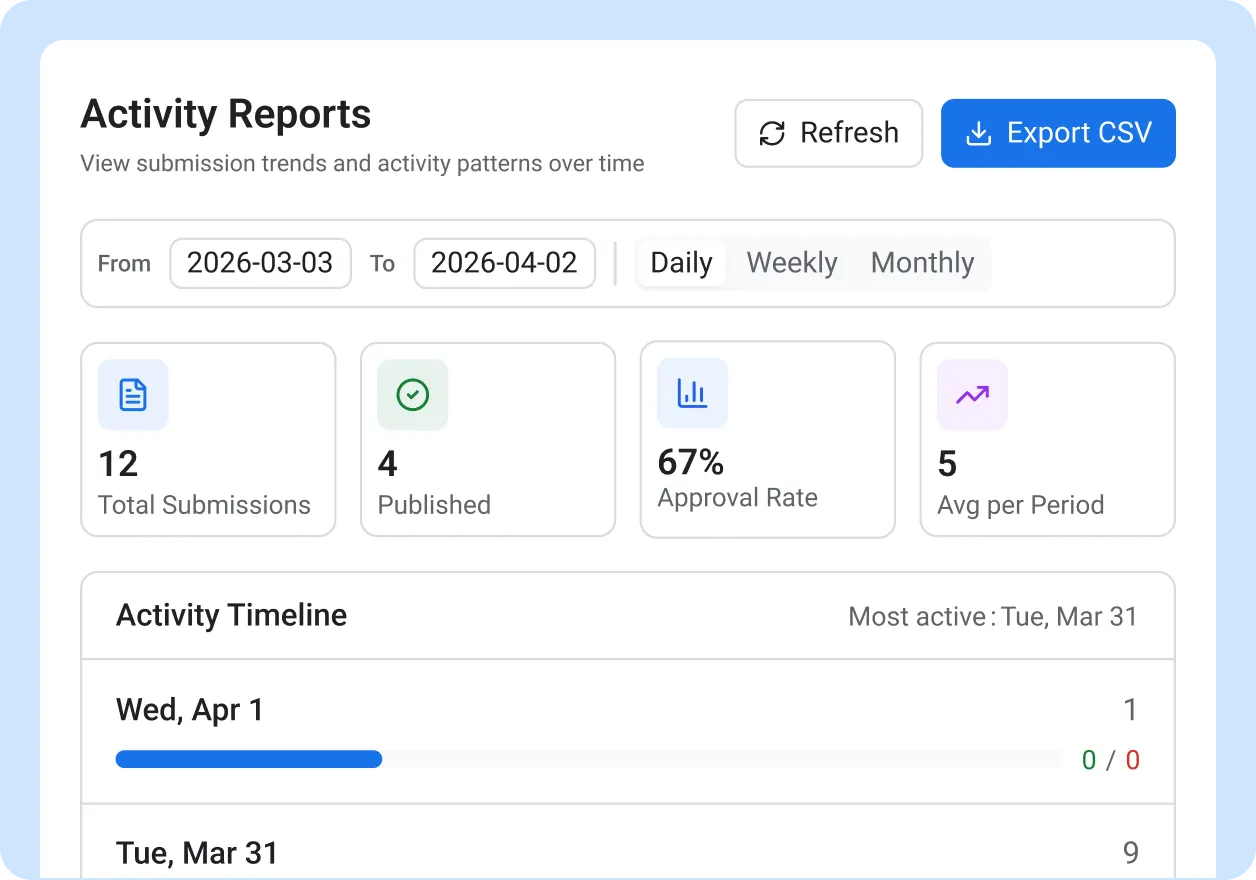
Break Down Activity by Period, Platform, and Location
Activity reports give you the cross-platform social media metrics your leadership team asks for. View content output by daily, weekly, or monthly periods. Unlike generic social media performance tracking tools, ContentBridge breaks down results by location, content type, and platform simultaneously. The overall approval rate and most active day stats tell you when your team produces its best work.
- Daily, weekly, and monthly period breakdowns
- Content type and platform distribution charts
- Location activity table with geographic detail
- Overall approval rate and most active day indicators
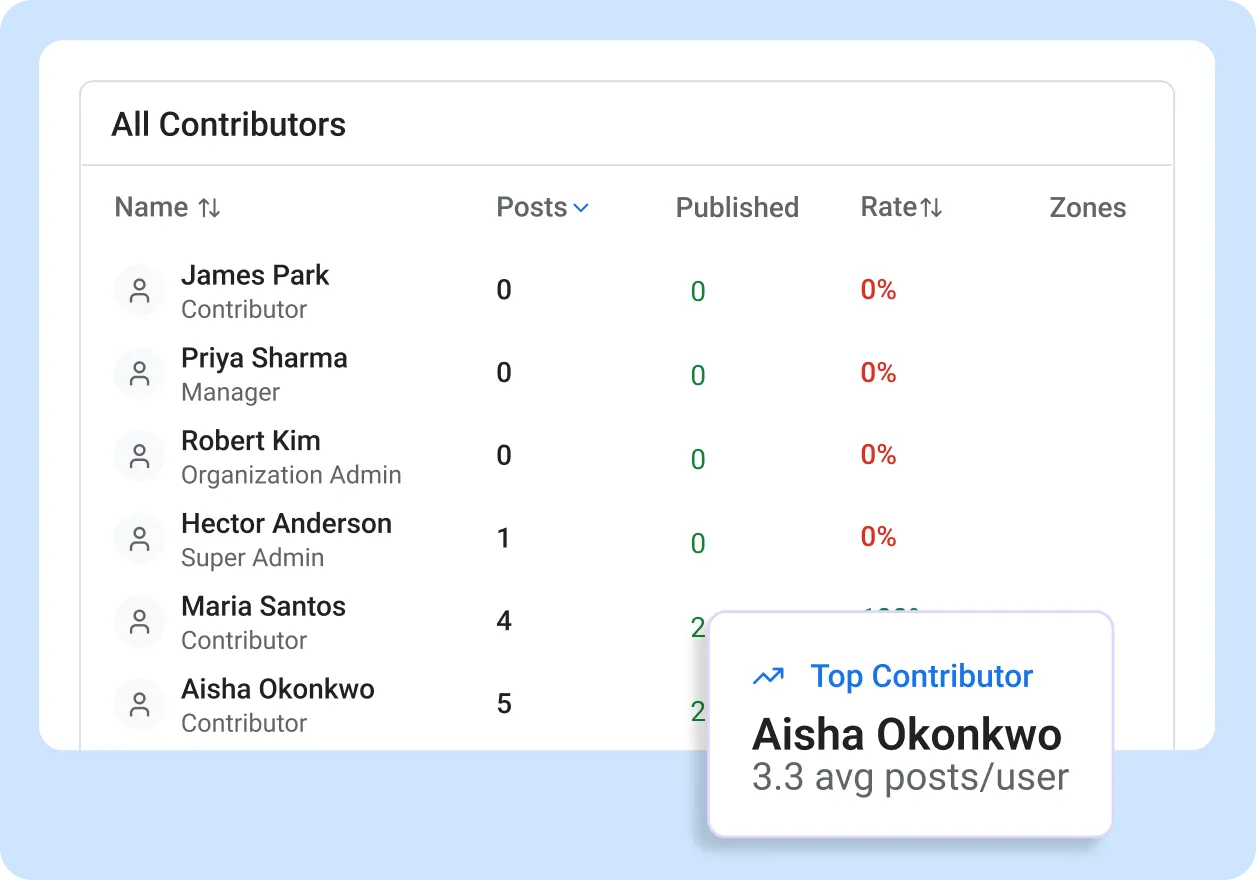
Turn Performance Data Into Recognition With Leaderboards
Leaderboards bring gamification to your employee advocacy programme, ranking contributors and making performance visible across the organization. Gold, silver, and bronze medals highlight your top creators. Trend indicators show who is climbing and who has dropped off. Filter by department to compare teams, and switch between weekly, monthly, quarterly, and all-time views to track momentum over any period.
- Ranked contributor list with gold, silver, and bronze medals
- Trend indicators showing rank movement over time
- Weekly, monthly, quarterly, and all-time period views
- Department filter for team-level comparisons
What Makes This Social Media Analytics Platform Different
Every report is built around your organizational structure, not a single social account. Most social media analytics platforms measure vanity metrics like impressions and clicks. ContentBridge measures KPIs by people, departments, and locations.
Per-Contributor Social Media Performance Tracking
Every post is attributed to the person who created it. You see total posts, approved posts, approval rate, and territories covered for each contributor. Sort by any metric to find your most active creators or spot contributors who have gone quiet.

Daily, Weekly, and Monthly Activity Breakdowns
Activity reports break down your content performance by time period, content type, platform, and location. You see when your team is most productive, which platforms receive the most content, and how activity trends over weeks and months across your entire multi-location operation.

Gamification of Top Contributors
Top contributors are highlighted on the leaderboard. Trend indicators show rank movement so you can see who is climbing. Built-in gamification makes employee recognition visible and creates friendly competition between contributors, departments, and locations.

Department-Level Filtering
Filter any report by department to compare team performance. See which departments are producing the most content, which have the highest approval rates, and which need support. Leaderboards can show organization-wide or department-specific rankings.

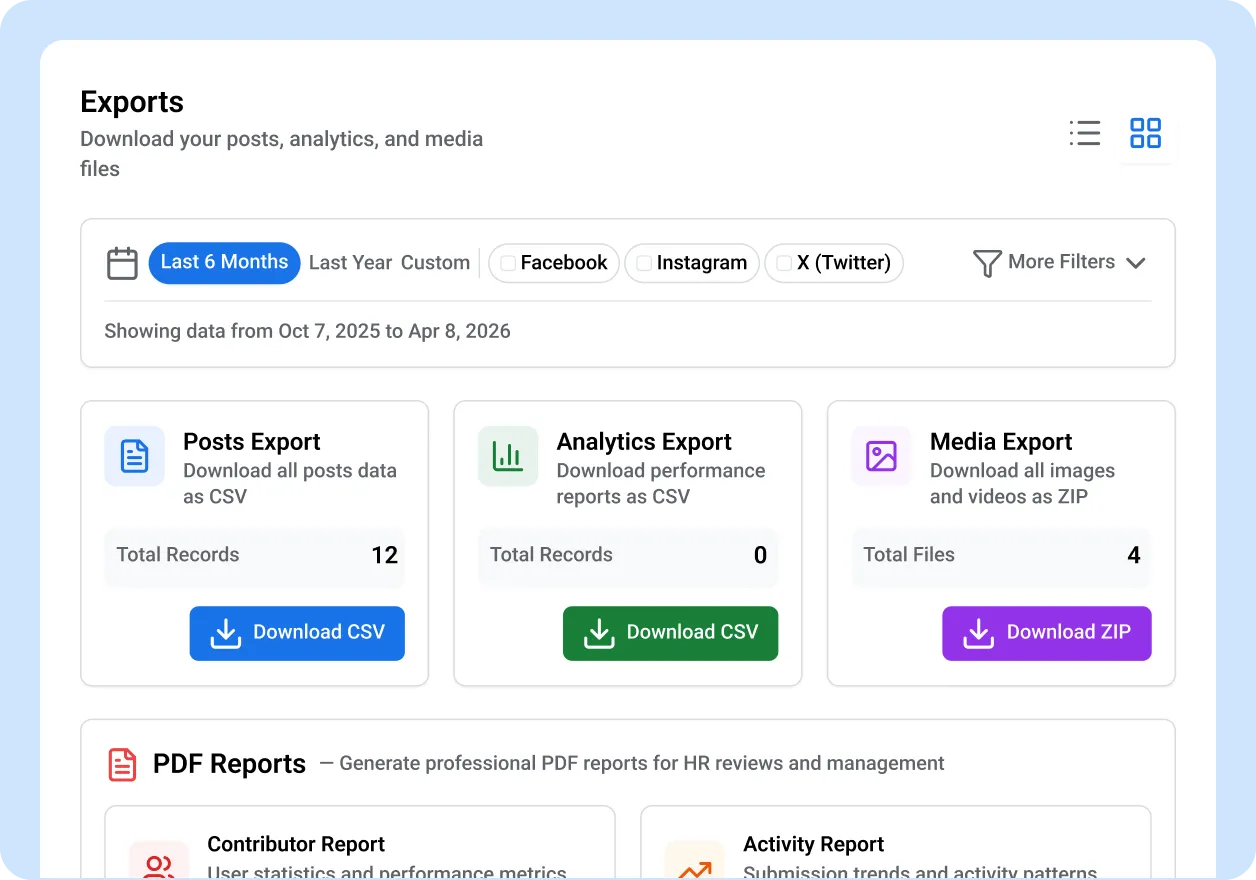
One-Click Report Exports
Export any report to CSV, PDF, or Excel with a single click. Date, platform, and status filters carry through to the export. Unlike most social media reporting tools, ContentBridge lets you go from live dashboard to formatted leadership presentation without manual data assembly.

Real-Time Organization Dashboard
Your dashboard shows team size, pending approvals, total content, and this month’s published posts the moment you log in. No query to run, no report to generate. The numbers update in real time as your team creates and publishes content.

“Before ContentBridge, our monthly social media report was a three-day project. My coordinator pulled data from four platforms into a spreadsheet, and the numbers still never answered the question leadership actually cared about: is this programme working? Now I open ContentBridge, pull up the contributor report, and show the executive team exactly which regions are active, who our top contributors are, and how our output has grown. The leaderboard turned content creation into a friendly competition between our 14 locations. We went from 40 posts a month to over 200, and I can prove it in two clicks.”

Lisa Fournier, Director of Marketing and Communications
Common Questions About ContentBridge Analytics and Reporting
How does ContentBridge track individual contributor performance?
ContentBridge generates contributor reports showing each user’s total posts, approved posts, approval rate, and territories covered. You can sort and filter by any metric, open a detail panel for each contributor, and export the full report to CSV. If you need to know how to measure social media content performance at scale, contributor reports give you a per-person answer rather than a single aggregate number.
Can ContentBridge break down activity by department and location?
Yes. Activity reports include cross-platform breakdowns by content type, platform, and location. You can filter leaderboards by department to compare teams across a multi-location organization. The location activity table shows where employee-generated content is being created geographically, and you can cross-reference this with territory coverage data. All views support daily, weekly, and monthly periods.
Does ContentBridge export reports for compliance documentation?
Every report in ContentBridge exports to CSV. The platform also supports PDF and Excel exports for activity data. These exports include timestamps, attribution data, and approval status, which organizations use to support PIPEDA, PHIPA, and ATIA documentation requirements. Organizations should consult legal counsel for their specific compliance obligations.
Do frontline workers see other contributors’ performance data?
Access depends on the role you assign. Frontline creators see their own post history and stats. Managers and administrators see contributor reports, activity reports, and leaderboards for the teams they oversee. Role-based permissions control exactly who sees what, so performance data stays visible only to the people who need it.
How quickly can we start generating reports in ContentBridge?
Reports populate automatically as soon as your team starts creating and publishing content. There is no separate setup step for analytics. Invite your team, connect your social accounts, and the dashboard, contributor reports, activity reports, and leaderboards begin tracking immediately. One of the most overlooked social media analytics best practices is starting measurement from day one; ContentBridge handles that for you. Most organizations see meaningful data within their first week.
Features That Work With Analytics and Reporting
Analytics track what your team produces. These features power the activity that feeds your reports.

Approval Workflows
Every approval action is tracked and attributed. Approval rates in your contributor and activity reports come directly from ContentBridge’s multi-level approval chain.

Content creation and publishing
Frontline workers create the posts that populate your reports. The more contributors you onboard, the richer your analytics become.

Department management
Departments organize your team into the groups that analytics report on. Filter contributor reports and leaderboards by department to compare team performance.